Our Data Visualization Projects
NEW FROM NVOLVE SCHOLARS

Fall 2023
Delving into the health indicators of Wisconsin and Maryland, these visualizations shed light on disparities in chronic disease outcomes and prompted reflections on the potential influence of demographics and environmental factors. I hypothesized that Black minority groups would have a lower amount of vegetables and fruit consumed because of the likelihood of food deserts in their neighborhood and the built environment. Read more…


Fall 2023
Meteorites are space rocks that fall to the earth’s surface. Our analysis of the data focused on the size of the meteorites, and where they have fallen in their various quantities. We focused on looking at where meteorites are mostly falling in the United States and saw that the most meteorite landings are along the New Mexico and Texas border. It was also very interesting to see which meteorites the heaviest and largest meteorites, Xifu and Al Hagggouria, weighed three million grams. Read more…


Fall 2023
For our project, we looked at the 2020-2021 rates of binge drinking, heavy drinking, and total alcohol consumption per capita in different states and compared it to the rate of liver disease mortality in those states. To see if there was any correlation between the groups, we created a bar graph to visualize liver disease mortality rates in all 50 states, color coding the top 10 states in a gradient red, the lowest 10 states in gradient blue, and the middle 30 states in a gradient purple. Read more…


Fall 2023
We analyzed the mortality rates of total cardiovascular disease among different race and ethnic groups in Maryland. Read more…


Fall 2023
Preventive dental care before pregnancy is hugely important. Since 2016, prenatal dental care has significantly declined. Its prevalence varies among states in the US, with many Northern states exhibiting higher rates compared to the South. Interestingly, White and non-Hispanic populations exhibited a notably higher rate of prenatal preventive care. Read more…


Fall 2023
By analyzing meteorites’ classification, mass, and landed location, we found that the number of meteorites that fell each year were most significant between 1970 to 2011. Among the five main types of meteorites, chondrites were the most abundant. The regions where most meteorites were found include Antarctica, the United States, Australia, North Africa and the Southeastern Gulf area near Oman. Read more…


Fall 2023
We scoped out the correlation between chronic disease indicators with life expectancy in which we observed the ten highest and ten lowest life expectancy states. Read more…

PREVIOUS PROJECTS

Spring 2023
Ecological footprint: It is a method developed by the Global Footprint Network to measure human demand on natural resources. In other words, the quantity of nature it takes to support people and their economies.
EcologicalDeficit: Countries use more natural resources (Ecological Footprint) than their ecosystems can generate (biocapacity). They are running an “ecological deficit”.
Ecological reserve: When a country’s biocapacity exceeds its population’s ecological footprint, it has an ecological reserve. Read more…


Spring 2023
This experiment aimed to see how the number of COVID-19 cases varied by race between 2020 and 2022. This investigation was limited to Maryland, United States. The data was collected by the state of Maryland and made available to the public. The data set comprised information from White, African American, Hispanic, Asian, and Other people. Read more…


FALL 2022
The goal of this project was to determine how the number of COVID-19 cases differed by race over time between 2020-2022. This analysis focused on Maryland, United States, and disregarded any other geographical locations. The data was collected by the state of Maryland and posted for public use. The data set included data from White, African American, Hispanic, Asian, Other, and “Not Available” races. Read more…


FALL 2022
In March 2020, the World Health Organization declared COVID-19, the disease caused bySARS-CoV-2, a pandemic (‘WHO Director-General's’, 2022). Our goal is to communicate whether the prevalence of mental health issues in five states in the United States with the lowest mental health is correlated with the COVID-19 pandemic. Read more…


SPRING 2022
The COVID pandemic has affected all aspects of our society, including flight availability. Through the COVID pandemic, states have made their COVID policies to decrease the spread of the disease. Some states like Texas and Florida have enforced minimum restrictions, whereas states like New York and California have enforced strict COVID mandates. Read more…


Spring 2023
Our team has analyzed the SHIP Life Expectancy 2015-2017 data set from the Maryland Department of Health. The main objective was to study how life expectancy has changed and varies across diverse ethnic groups and jurisdictions. To achieve this, we utilized various charts and visualizations in Tableau. Read more…


Spring 2023
Our project focused on the life expectancy data of Maryland from 2007-2017. This dataset came from the from the Maryland Department of Health. When we got the data we didn’t expect to have as many gaps and missing data as it did. Our data was missing data for certain demographics such as White Hispanic, Native American, and Asian populations. This is very significant data as White Hispanic make up 18.7%; of Maryland's population and Asians alone makes up 6%, and Native American is .7%. Read more…


FALL 2022
Air Pollution is caused by various contaminants such as NO2 (ug/m3), PM10 (ug/m3), and PM2.5 (ug/m3) present in the atmosphere. These contaminants are very harmful to human health and so precautions are required. The World Health Organization (WHO) offers global guidelines for important pollutants that risk human health and the environment. In this project, we aim to create two dashboards using Tableau to visualize air pollution over the world by addressing our individual questions. The data that we used is from the WHO Air Quality Database. Read more…


FALL 2022
The COVID-19 pandemic impacted people all across the globe. Most developed countries imposed social distancing and quarantines during the peak of the pandemic. This resulted in behavioral changes such as working from home, avoiding traveling, social distancing, and closure of businesses related to entertainment. Read more…


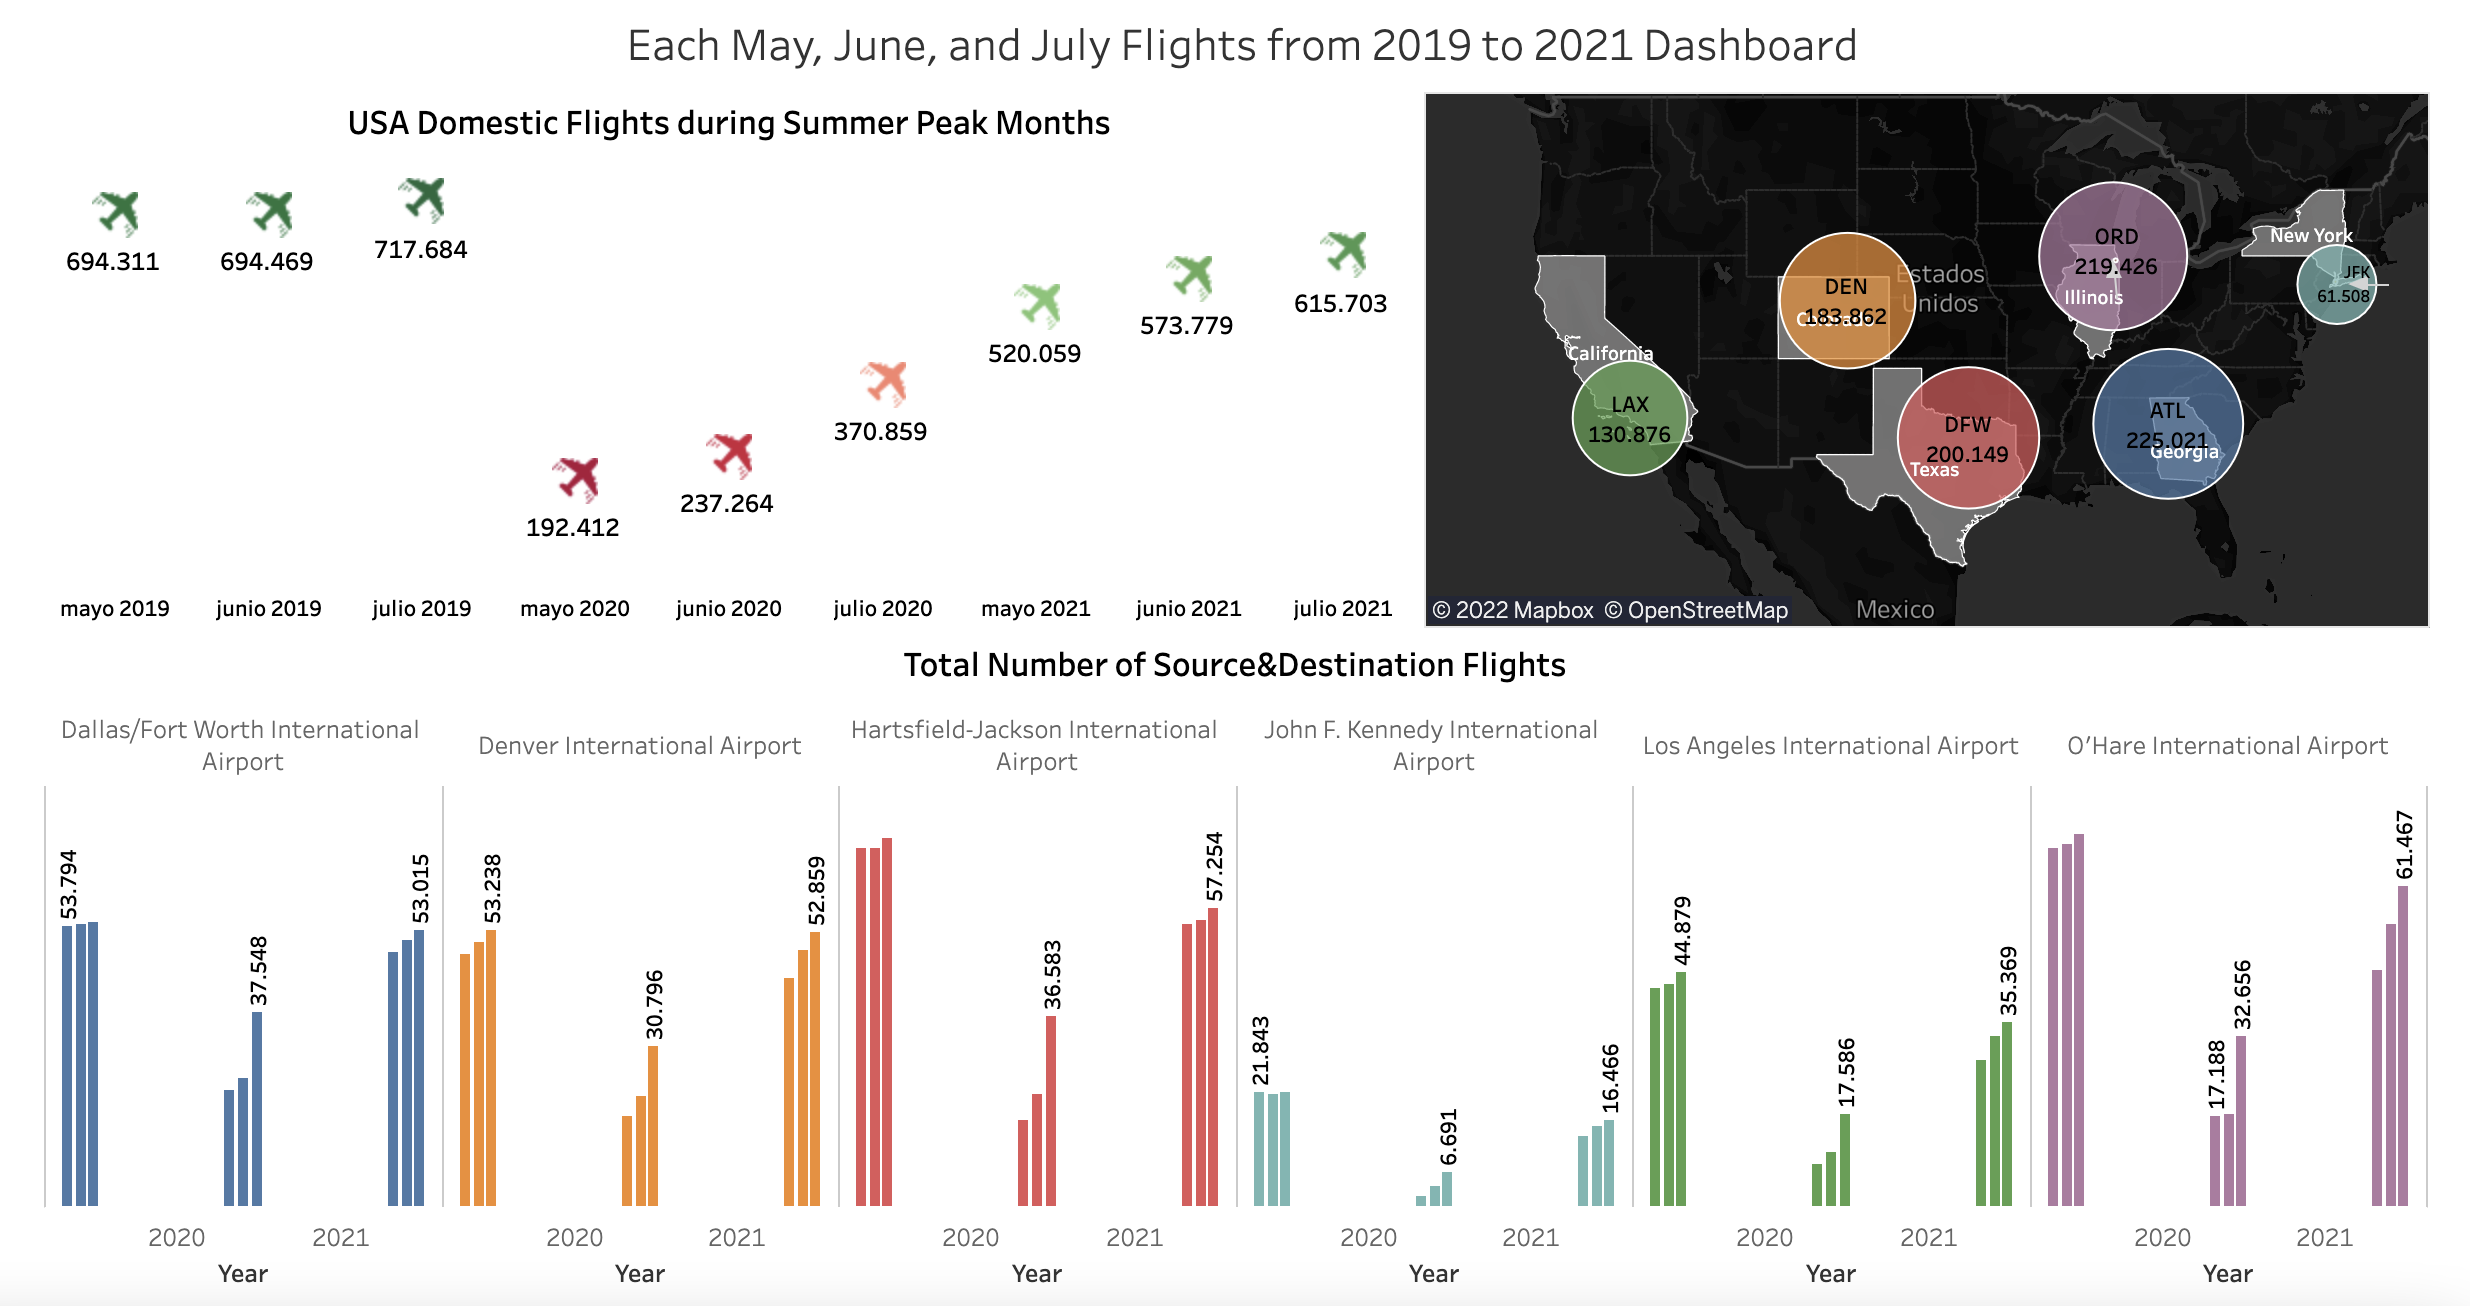
SPRING 2022
Many industries and businesses have been affected by the Covid-19 pandemic. One of the hardest-hit industries in the early months of the pandemic was Airlines. This project analyses different airlines' flight data between 2019-2021 to study the effect of the pandemic among the United States airlines. Read more…