
Our Projects Visualizing Data Using Python
Biology students with no prior coding experience learn to create insightful visualizations for complex biological data from scratch. Through a hands-on approach, these scholars have gained foundational coding skills and can confidently use Python to transform raw data into meaningful visuals.
New Scholar Projects
Spring 2026
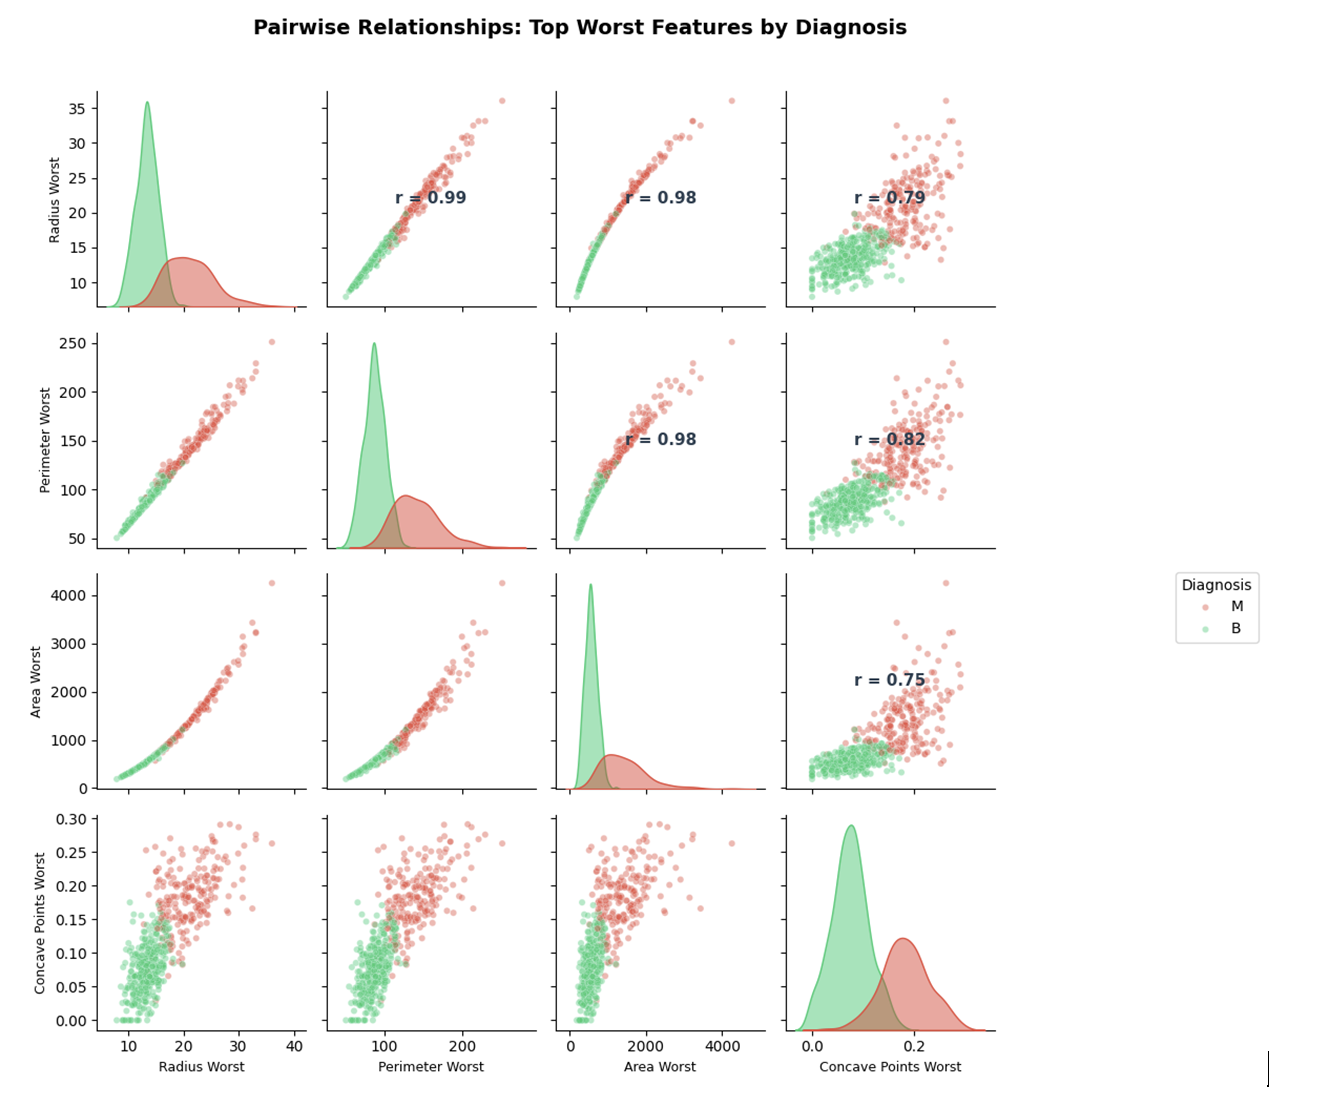
Using the Wisconsin Diagnostic Breast Cancer dataset, we analyzed differences between malignant and benign tumors through data visualization and machine learning in Python. Histograms, boxplots, and pair plots were used to examine tumor characteristics and identify the features that best distinguish the two groups. We then trained and evaluated a Random Forest model to compare classification performance using different sets of features. By combining exploratory data analysis with predictive modeling, this work demonstrates how Python can be used to uncover meaningful patterns in medical data and support more accurate disease classification.

Spring 2025
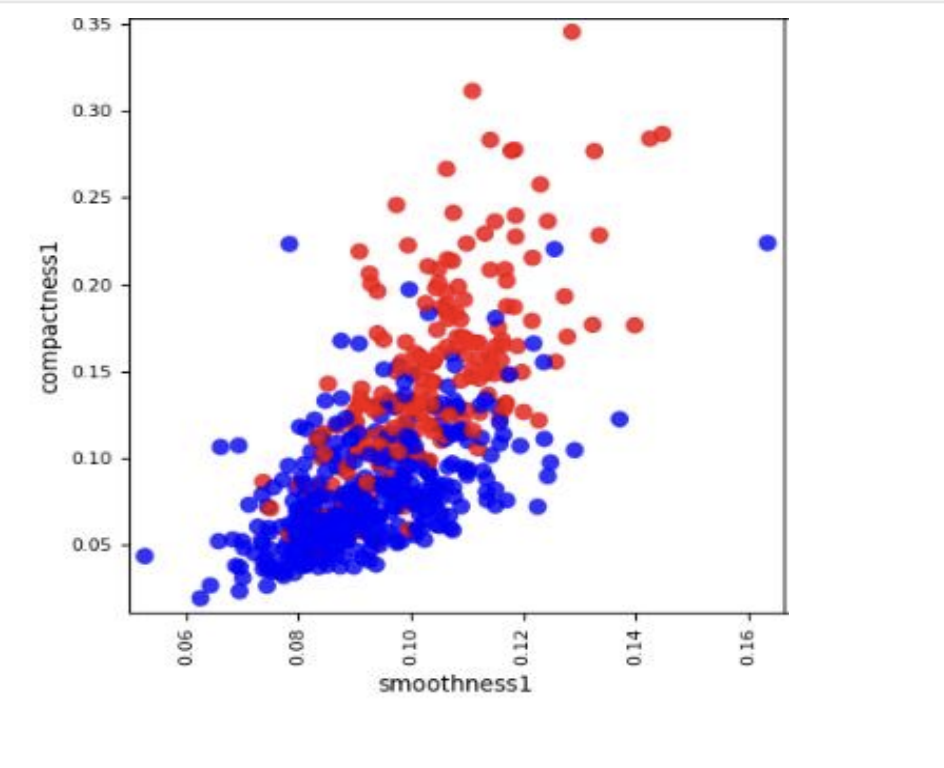
An increase in the concave regions of a cell’s nucleus often correlates with greater compactness in its shape. As these indentations multiply, the nucleus tends to tighten and become denser, reducing internal open space. Explore how Dalal and Abigail navigated their data analysis journey. Learn more.

Fall 2024
Detailed analysis of the Wisconsin Breast Cancer dataset explored tumor features such as concavity, symmetry, perimeter, and compactness. Using visualization techniques, the findings highlighted patterns that distinguish malignant from benign tumors, providing insights for improved diagnostic accuracy. Read more

Spring 2024
The number of concave points on a cell nucleus and the compactness of the nucleus are directly proportional. As the number of concave points increases, the available free space within the nucleus becomes more limited, resulting in a more compact structure. Read about Dalal and Abigail’s experiences Read more.